Dashboard
LarvIA Dashboard
It is a tool that facilitates and delivers to its users Business Intelligence (BI) for decision making with historical data and real-time reports. It allows comparisons of past own sowings and with the market in general.
Also the user management, make payments, quota expansion and provides options to share reports with a QR code generator to send to your collaborators, clients, allowing them to enter from any device and anywhere in the world.
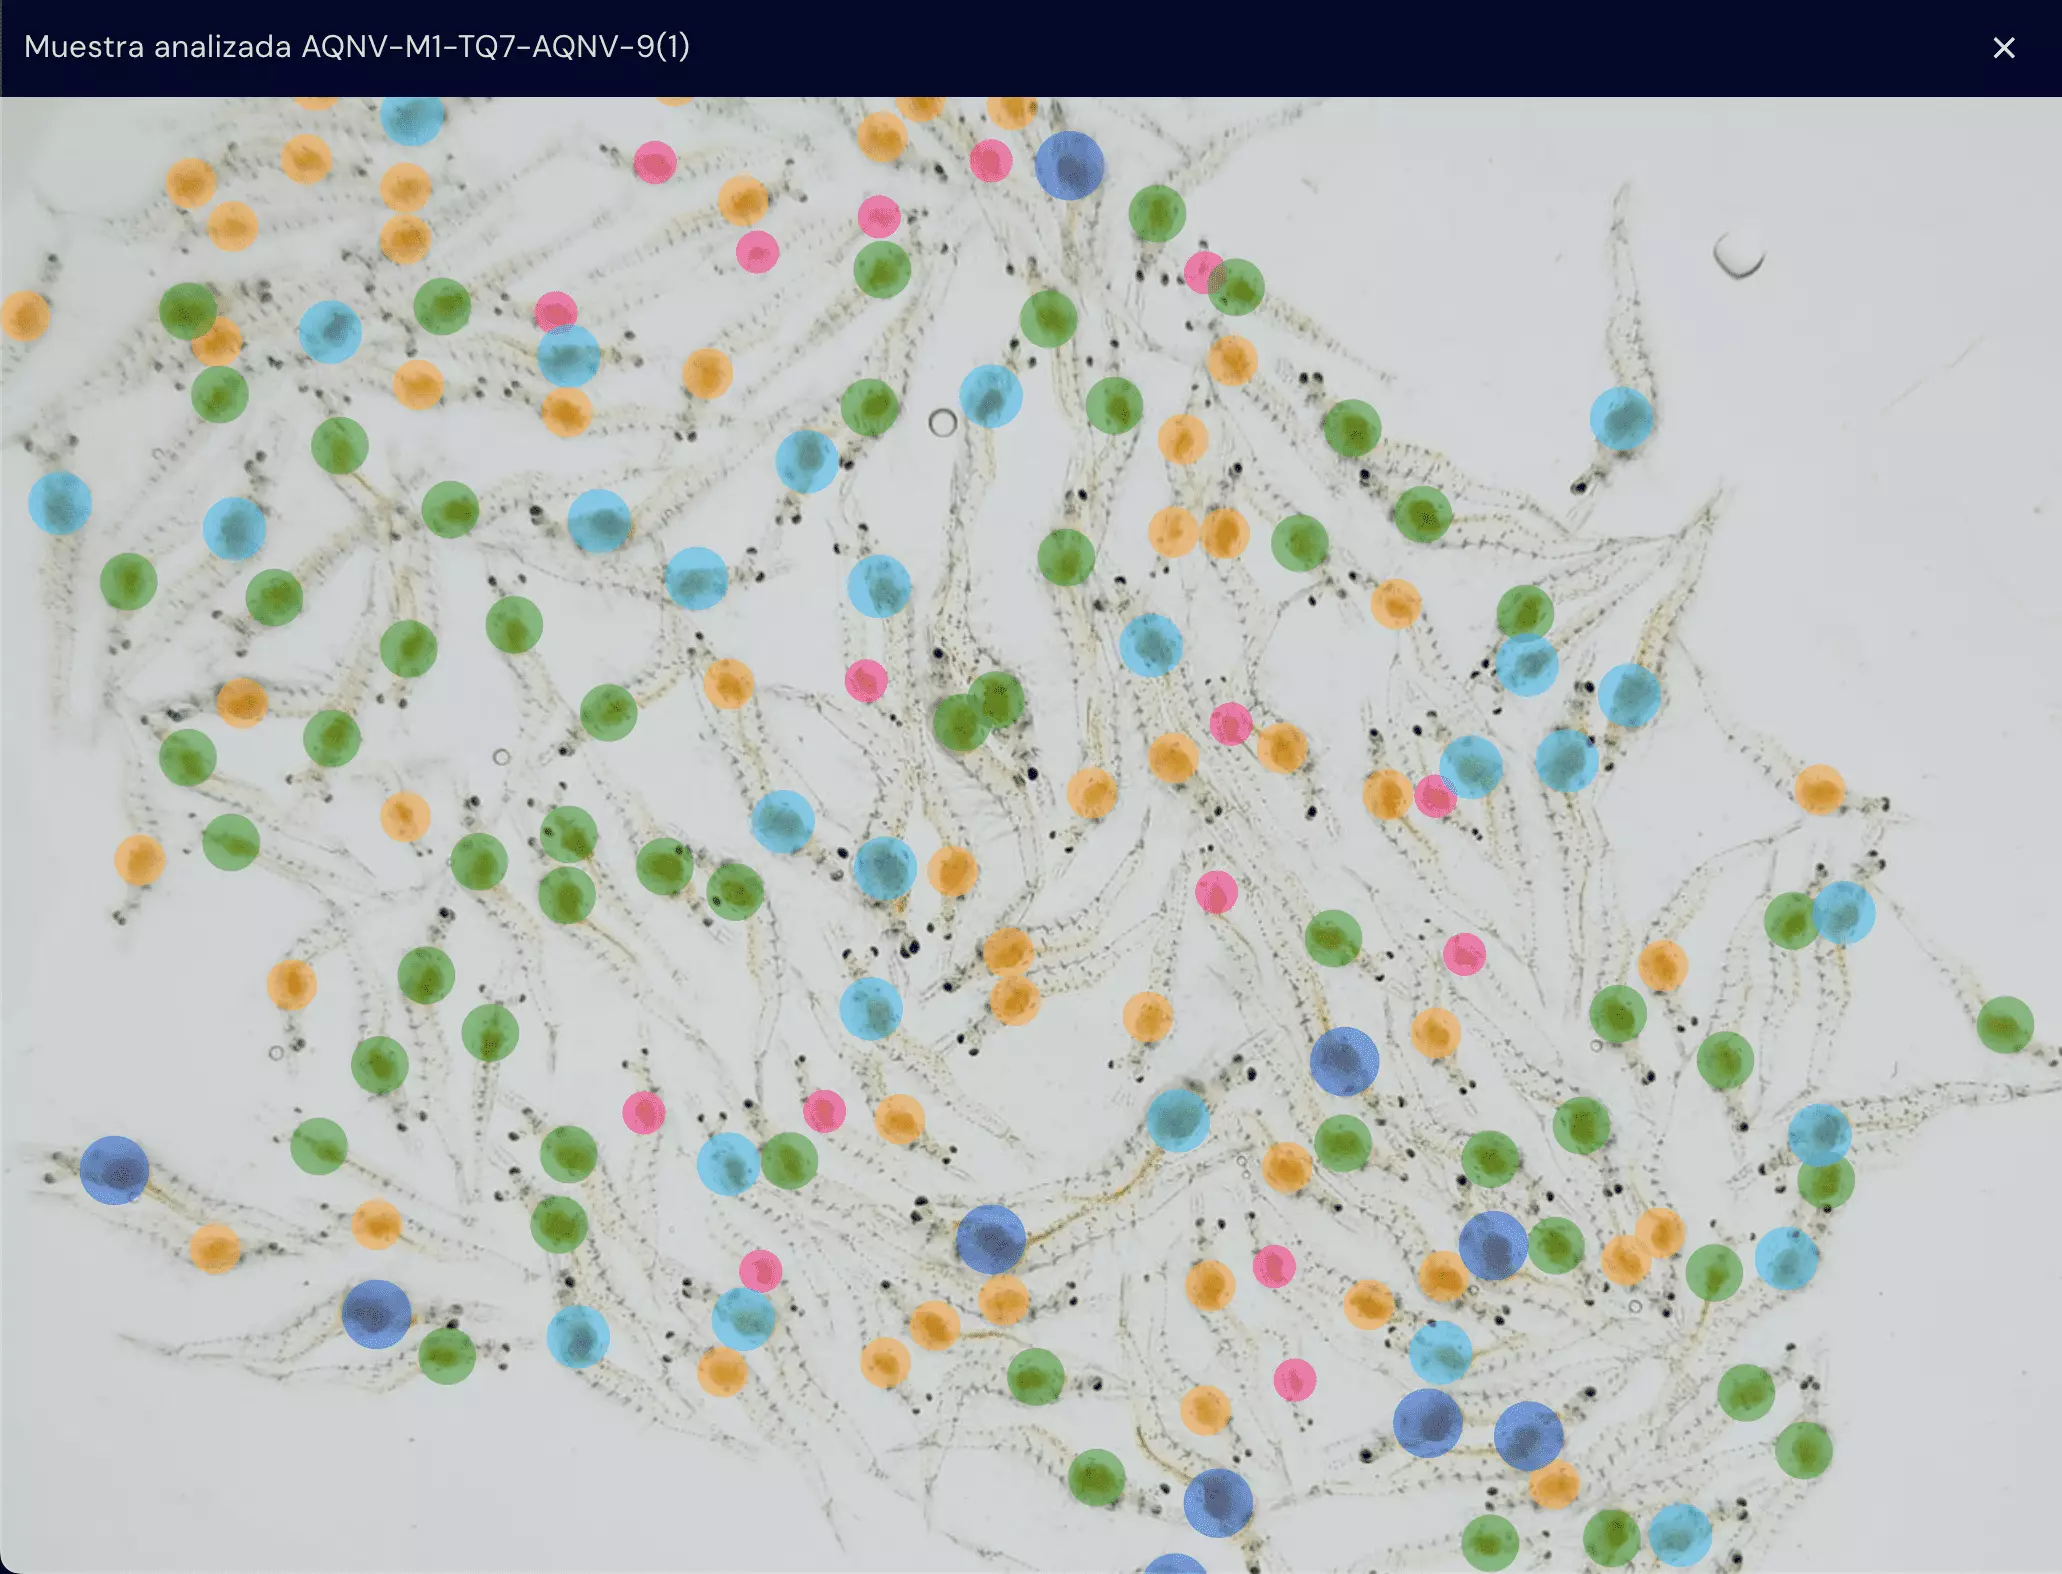
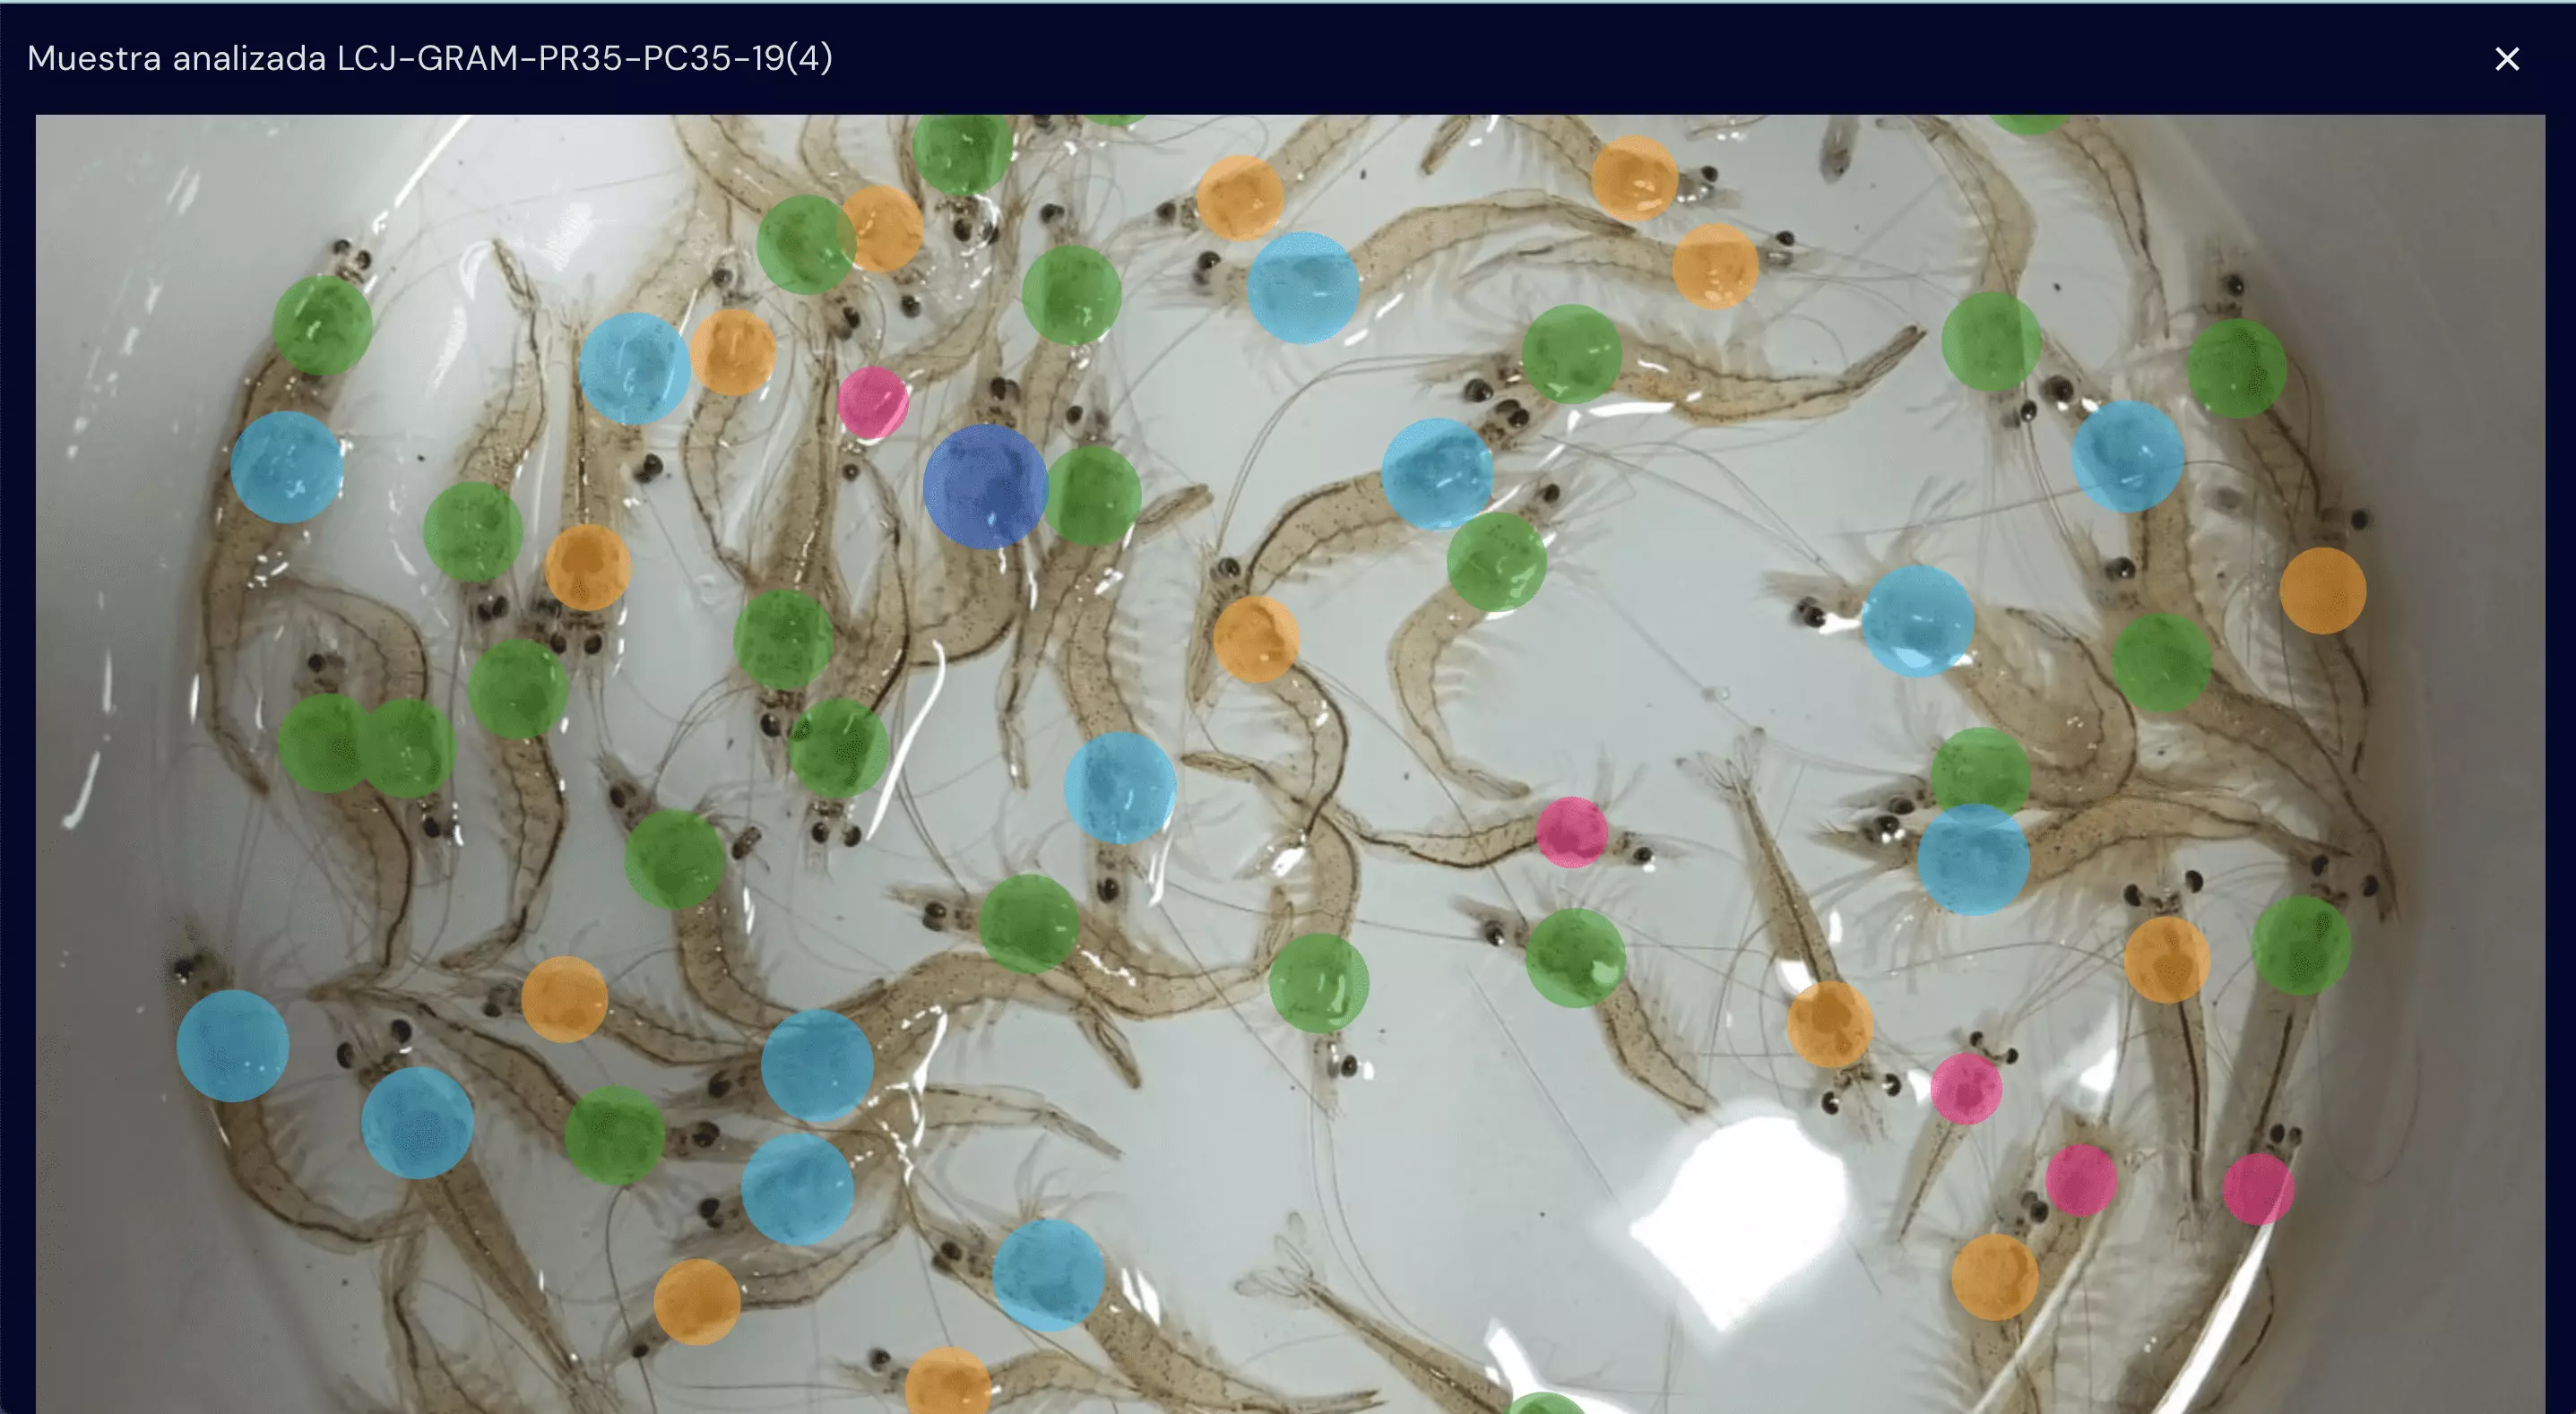
Result of an Analysis
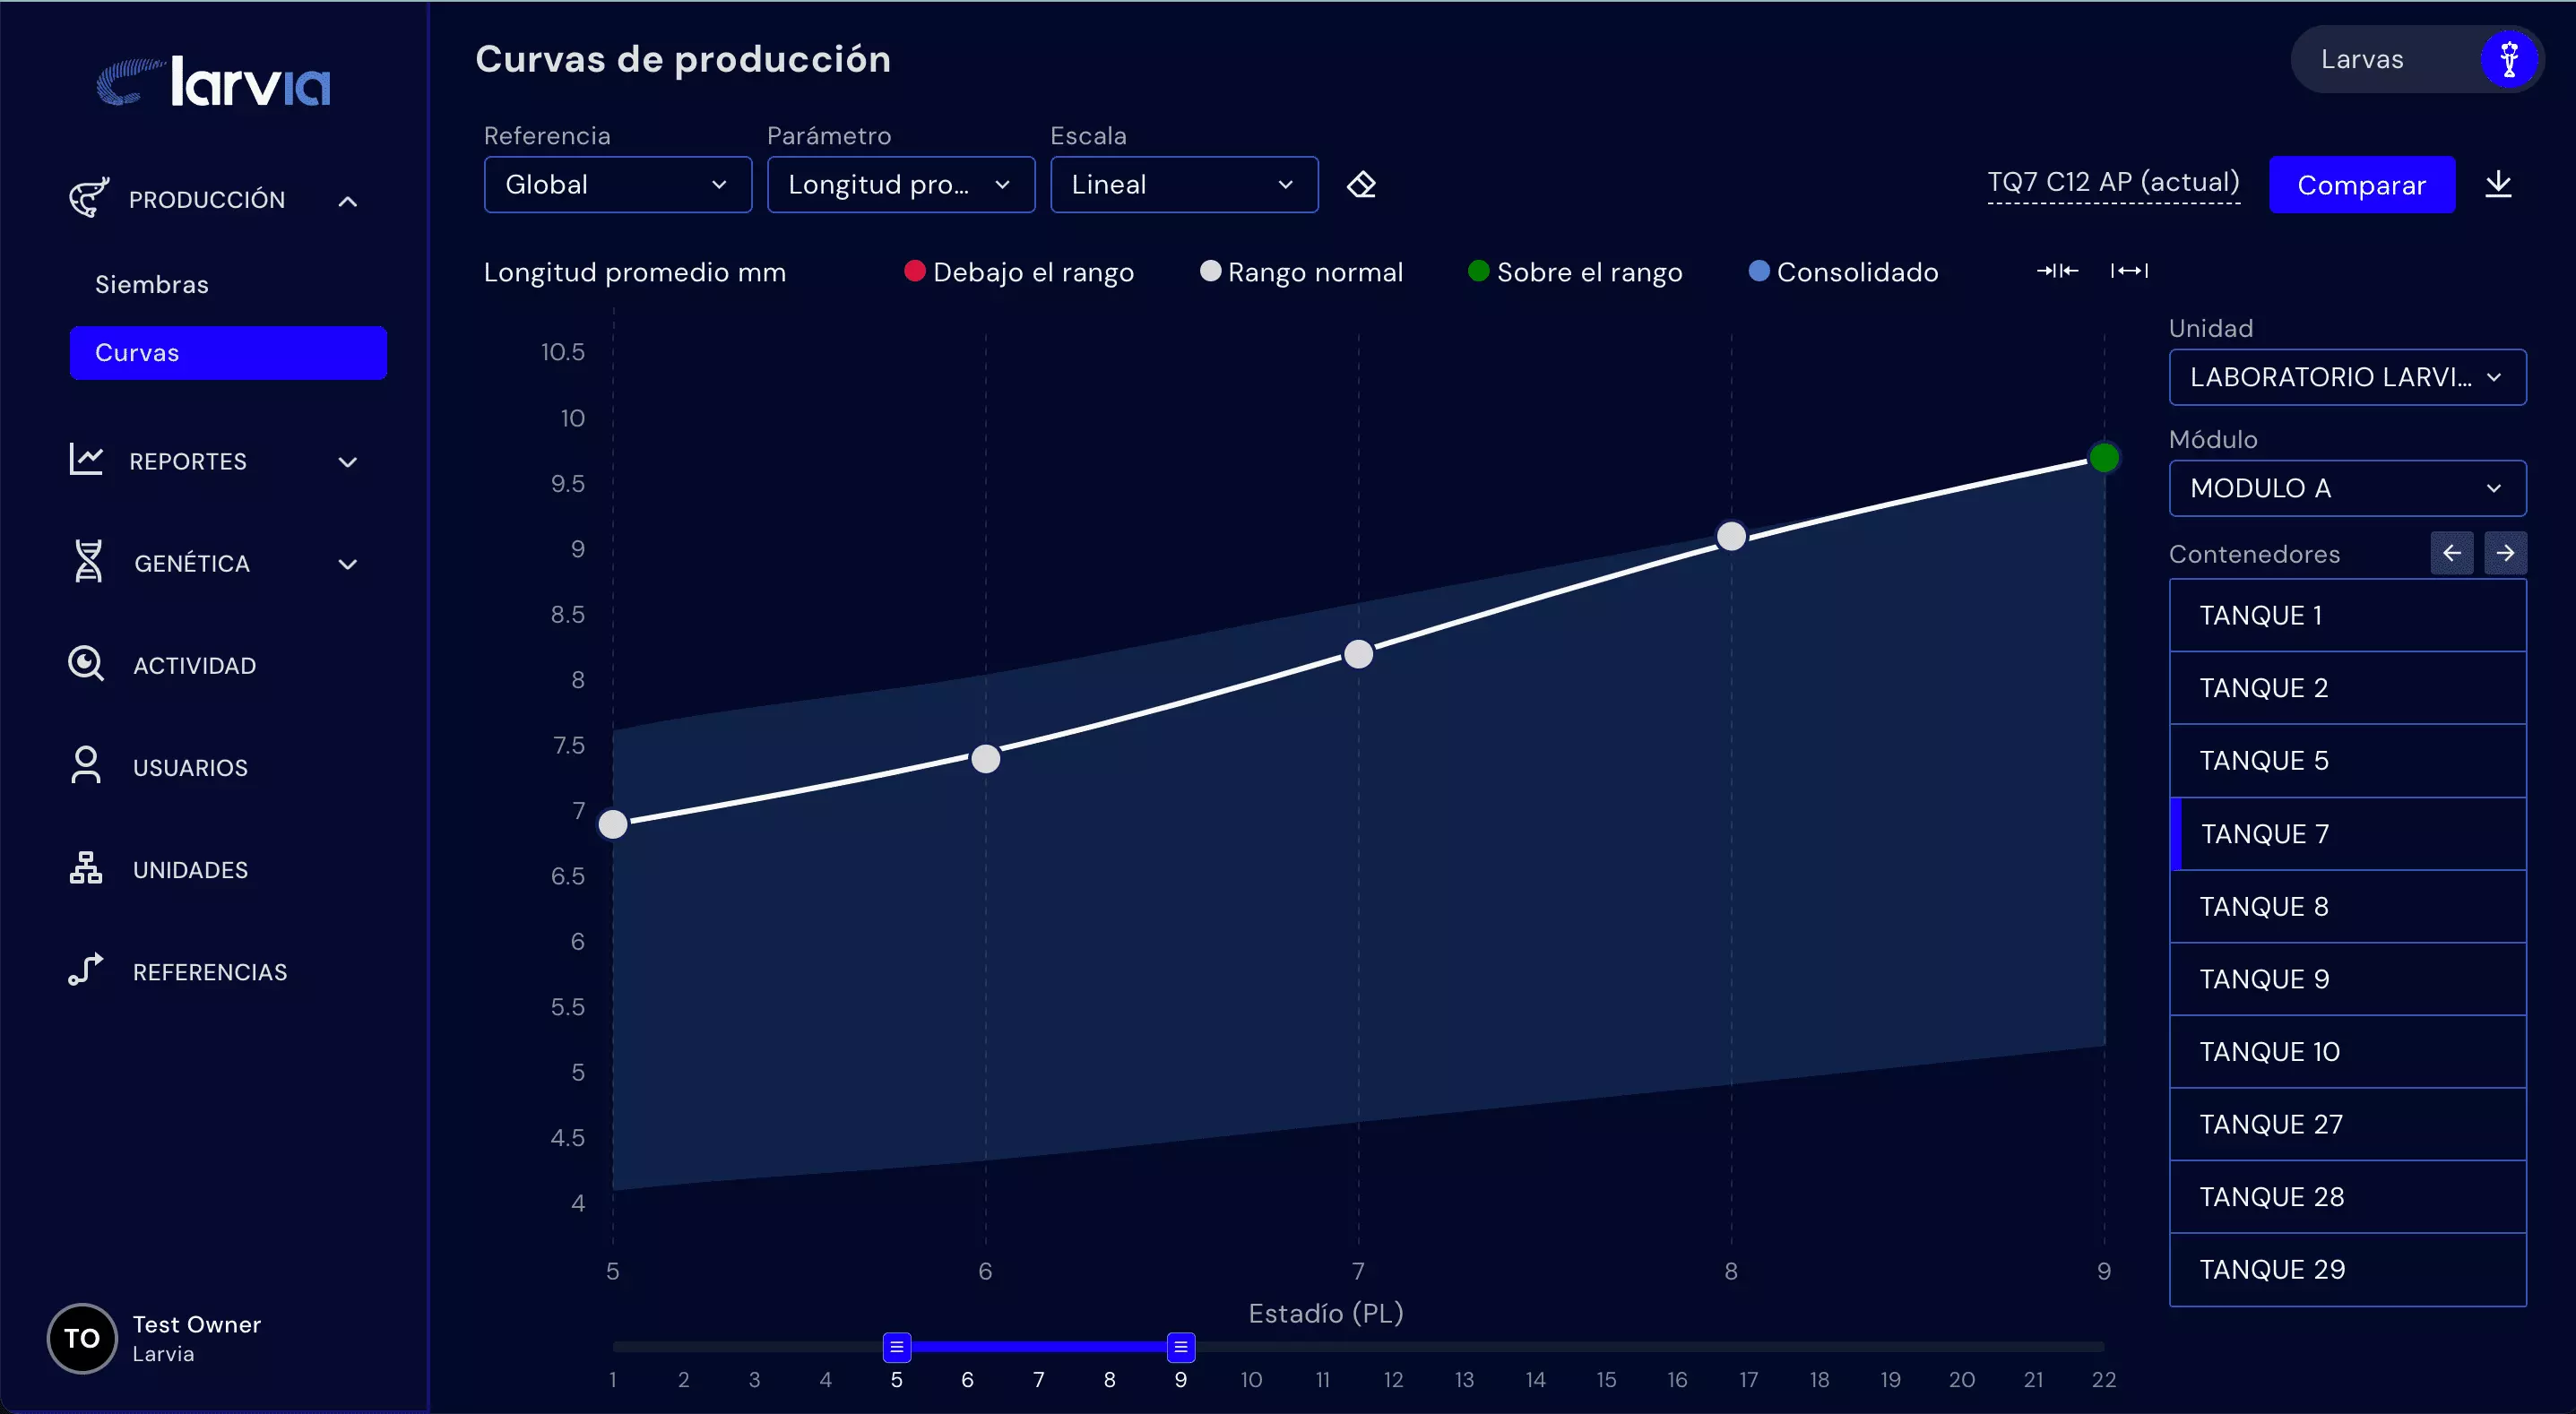
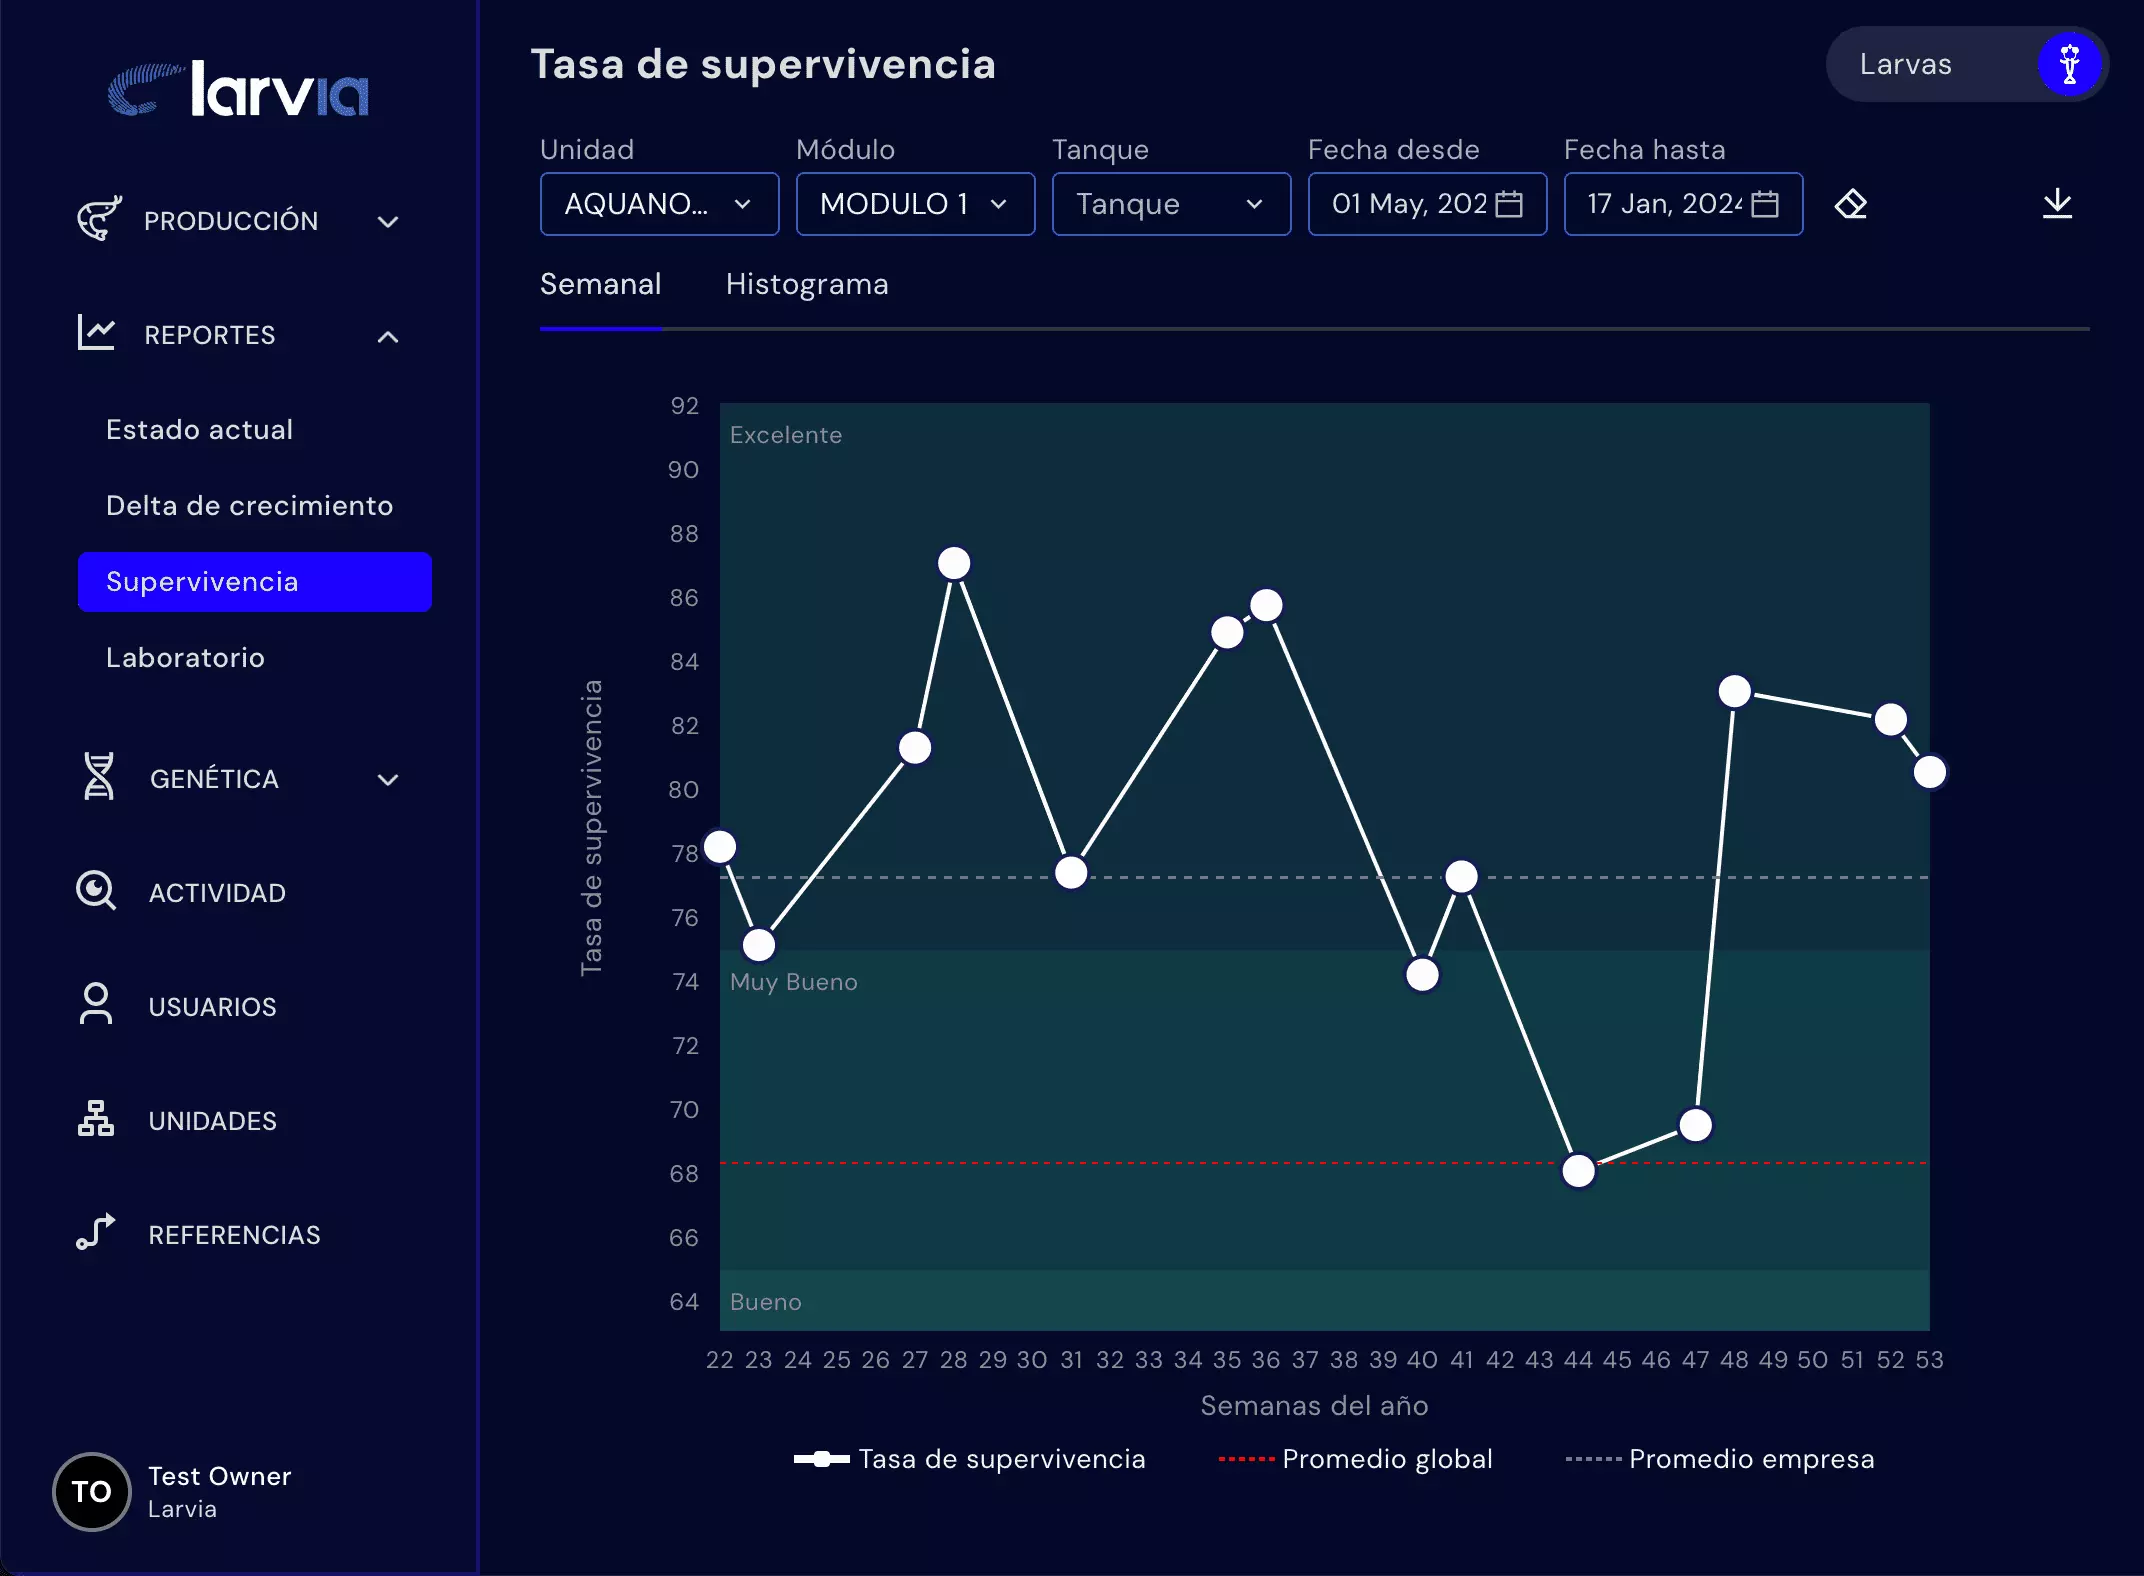
Interact on our Web Dashboard, review sample results, location, detection,
the histogram of weights, length, pigmentation, the graphs of animals by group.
Different phases
Know the current status of your shrimp stocking only with a photograph,
in all its stages, larva, juvenile and adults.
Larvae
Recommended methodology
1 daily sample (photo) of each tank to complete traceability.
Tools
15W LED lamp
Petri dish
2 decimal digit balance
LarvIA app
Larvia Subscription
Juvenile
Recommended methodology
Take a minimum of 4 samples (4 photos) from different parts of each tank or pool and consolidate the 4 results for greater precision. Perform this process 2 to 3 times a week, especially during transfer processes, as it helps determine the average weight.
Tools
2 digit balance
White bucket or drawer
LarvIA app
Larvia Subscription
Grow Out
Recommended methodology
Take a minimum of 4 samples (4 photos) from different parts of each pool and consolidate the 4 results for greater precision, 1-2 times per week per pool.

Tools
2 digit balance
White bucket or drawer
LarvIA app
Larvia Subscription